


Biography
Biography: Kankana De
Abstract
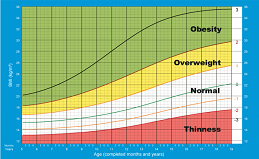
Introduction: The BMI is an attempt to quantify the amount of tissue mass (muscle, fat, and bone) in an individual, and then categorize that person as underweight, normal weight, overweight, or obese based on that value.
The BMI is generally used as a means of correlation between groups related by general mass and can serve as a vague means of estimating adiposity. The duality of the BMI is that, while it is easy to use as a general calculation, it is limited as to how accurate and pertinent the data obtained from it can be. Generally, the index is suitable for recognizing trends within sedentary or overweight individuals because there is a smaller margin of error. The BMI has been used by the WHO as the standard for recording obesity statistics since the early 1980s.
The study area of Salboni Block is 25 km away from Medinipur town. Subjects are 10-19 years adolescent girl. The study were done on 1009 girls. .
For these study different types of anthropometric measurements were taken like Weight, Height. Height is measured through Anthropometric rod; Weight is taken by weighing machine. Biceps skinfolds and Triceps skinfolds measurements are taken by skinfold Calliper. Height is measured to the nearest 0.1 cm and weight to the nearest 0.5 kg. Each subject was weighed with minimum clothing and no footwear.
Structured questionnaires were followed to know details of socio-economic status of studied adolescent Stature was measured to the nearest 0.1 cm in bare feet with participants standing upright against a wall-mounted stadiometer. Body mass was measured to the nearest 0.5 kg with participants lightly dressed (using a portal digital scale (Tanita HD 309, Creative Health Products, MI USA). BMI was calculated from the ratio of body mass index.
Statistical analysis: Data were entered in Microsoft excel 2007 and was analysed using SPSS 19.0. Descriptive statistics and chi square test were used wherever required, to test statistical significance. Statistical significance was set at p <0.05.
Results: FMI and BMI have weak correlation , Among them 24.4 % are under nutrient based on BMI and 99.8 % are undernutrient based on percent body fat.34.2 % low health status by assessing Rohrer index. According to Roc curve 18.45 kg/sqm will cut off value of ced this study.
Discussion: Under nutrient when reach at reproductive age still they are mal nourished and do not get sufficient nutritional supplement ,at child bearing stage they give low birth weight children and those children donot have nutrition ;they face the situation cycle which will go on . Malnutrition affects HIV transmission by increasing the risk of transmission from mother to child and also by increasing replication of the virus. In communities or areas that lack access to safe drinking water, these additional health risks present a critical problem. Lower energy and impaired function of the brain also represent the downward spiral of malnutrition as victims are less able to perform the tasks they need to in order to acquire food, earn an income, or gain an education.
Conclusion: Due to undernutrition adolescence experience development delay, which cause delayed puberty and delayed menarche. Malnourished adolescence is suffering from kwashikor , marasmus; undernutrition compromises with immune system, in rural areas poor sanitary system , open defecation causes worm infestation as its further effect they become anaemic.